General Questions
Where do the funds for Polaris Observatory come from?
Polaris Observatory was created by grants from the John C. Martin Foundation.

Updates of the Polaris Observatory are made possible by the generous grants from the following organizations:

If you find our data valuable, please consider a donation to support our work.
Why use Polaris Observatory data?
The Polaris Observatory has been in operation since 2015 collecting and analyzing national data. The Center for Disease Analysis have been doing the same since 2012. We have reviewed our analyses with national experts in over 80 countries/territories and believe they represent the best available data. We update all of our models annually (taking into consideration new prevalence estimates, treatment rates, vaccination rates, mortality estimates and disease progression). The data presented here includes the best available estimates of hepatitis burden and progress toward elimination, given the usual shortcomings facing epidemiology forecasts.
Who is funding the operation of Polaris Observatory?
The Polaris Observatory was created through grants by the John C. Martin foundation. The operation of the Polaris Observatory in 2021 is supported by the John C. Martin Foundation, the ZeShan Foundation, the EndHep2030 Hepatitis Fund, Gilead Sciences and AbbVie. The funders do not influence the data or analyses presented here.
Why is the data presented here different than my national data?
Many national reports present data without taking into account the impact of new infections, mortality, treatment, and vaccination (HBV) since the data was collected. We update every model annually to make sure that each country’s/territory’s data contains the latest available datasets. We believe our estimates represent the best available data after taking the impact of time into consideration.
Why is your data different than those reported by the World Health Organization (WHO) or Global Burden of Disease (GBD)?
Updating the Polaris Observatory takes a dedicated team that works on modeling only hepatitis B and C every single day. We spend months reviewing our dataset and questioning its validity. We also spend hours discussing our inputs with national experts in each country/territory. Our models were built specifically for viral hepatitis and have been the subject of over 60 peer review publications. The modeling helps us estimate the hepatitis disease burden each year.
We develop bottoms-up estimates by collecting data from each country/territory and then developing the global/ regional estimates. IHME’s Global Burden of Disease (GBD) estimates use a top-down approach where the total number of HCC cases are estimated and then allocated to different indications followed by different regions. The IHME approach works very well at the global level across all diseases since it makes sure that total number of deaths, HCC cases, and cirrhosis are not double counted. At the global level, our estimates are similar to IHME’s estimates with regard to the total number of deaths due to hepatitis (~1.1 million deaths due to HBV or HCV). However, their breakdown between HBV and HCV, as well as their estimates at a national or regional level will be different than ours.
WHO works with external partners as well as WHO country/territory and regional offices to collate and collect data from a variety of sources. This includes supporting serosurveys and data collection efforts through the global hepatitis monitoring system. However, WHO can only report national data that have been endorsed by countries/territories. Occasionally, the data available to and reported by national programs reflect only part of the story (i.e. older data are reported because newer data aren’t available; data are reported from the public sector, but exclude efforts from the private sector; etc.). These are the same types of data that we collect, with the main difference being that our team works very closely with each country/territory to determine the appropriate way to extrapolate sub-national data to the national level, and then model forward the results to the latest year. As a result, the Polaris data typically do not match national program data or WHO data exactly. Our estimates and WHO’s estimates are converging as our data have been included as partner data for the WHO Global Report, and as more countries/territories report the estimates that we developed with them to WHO.
Where is the cascade of care data for my country/territory?
The Polaris Observatory stopped reporting cascade of care data for individual countries/territories. The data is available to national policymakers, decision makers and our collaborators through the https://cdafound.org/polaris-observ-access/ portal free of charge. Other organizations can access the same data for a fee. The revenue will be used to support the ongoing operation of the Polaris Observatory. The same portal can be used to find data for each country/territory, region and global from 2015-2030.
Will Polaris data change over time?
Yes. We update every national model and regional models once a year taking into account the latest available data and impact of time. When referencing our data, please use the following format to indicate what dataset was used: CDA Foundation’s Polaris Observatory; INSERT YEAR [updated INSERT UPDATE DATE SHOWN ON THE BOTTOM OF THE PAGE]. Available from https://cdafound.org/polaris/(Accessed INSERT ACCESS DATE).
Why are some numbers in the cascade of care reported at the end of the year while others are reported at the start of the year?
Imagine you are in Egypt and you have treated and cured 500,000 HCV patients in a given year. How would you report your numbers? The Polaris Observatory reports HCV prevalence at the start of the year (January 1) and diagnosed, treated and mortality at the end of the year (December 31). Thus, HCV prevalence is not dependent on the total diagnosed, treated and deaths in the same year. This approach has minimal impact on HBV prevalence since it is only dependent on mortality (HBV treatment is not curative).
Can I use the data presented here in my presentation / report?
Yes. However, we ask that you reference the data. A recommended format follows: CDA Foundation’s Polaris Observatory; INSERT YEAR [updated INSERT UPDATE DATE SHOWN ON THE BOTTOM OF THE PAGE]. Available from https://cdafound.org/polaris/ (Accessed INSERT ACCESS DATE).
How do I reference the data presented here?
We recommend the following format: CDA Foundation’sPolaris Observatory; INSERT YEAR [updated INSERT UPDATE DATE SHOWN ON THE BOTTOM OF THE PAGE]. Available from https://cdafound.org/polaris/ (Accessed INSERT ACCESS DATE).
How can I copy the figures for my presentation?
There are two types of charts used on this website. If you see three parallel lines on the upper right corner of the graph, you can click on it and it will allow you to save the graph locally.
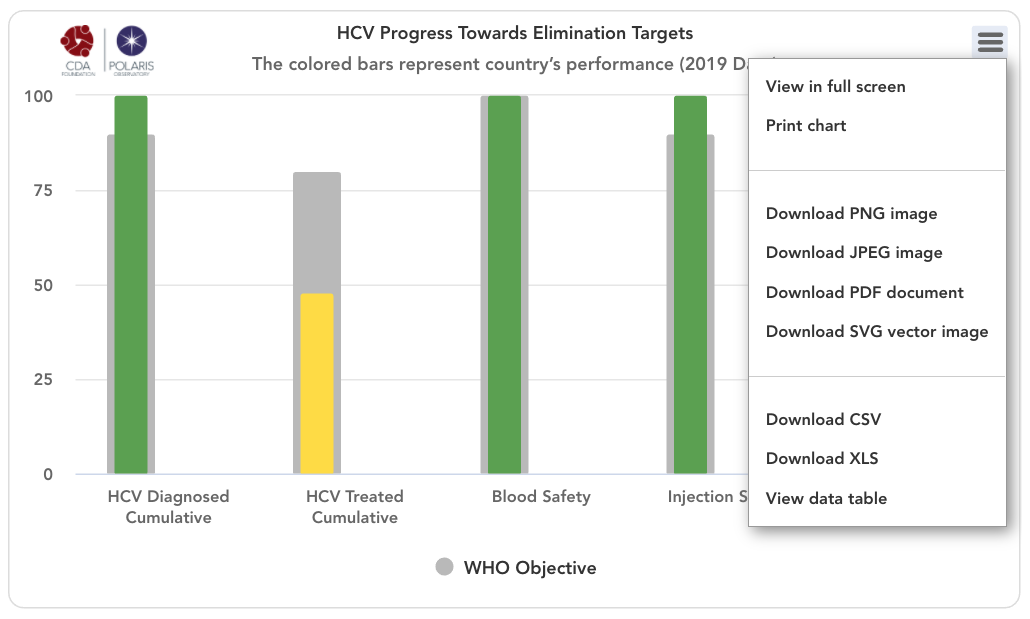
For the other figures, we recommend making a screenshot and saving it locally to insert in a presentation.
Can I use the data on Polaris Observatory on my website?
No. You can provide a link to the Polaris Observatory from your website. Exceptions are made for national governments and Ministry of Health websites. Please contact us at info@cdafound.org.
HCV & HBV epidemiology data explained
Population and adult population source
Division UNDoEaSAP. World population prospects: The 2019 revision New York: United Nations; 2019 [updated 2019 Online version updates various data. Available from: https://population.un.org/wpp/ (accessed Dec 1, 2019). All numbers were rounded.

World Bank classification source
World Bank Country and lending Groups, The 2020 revision. Available from: https://datahelpdesk.worldbank.org/knowledgebase/articles/906519-world-bank-country-and-lending-groups (Accessed Dec 1, 2019). All numbers were rounded.

HCV Diagnosed
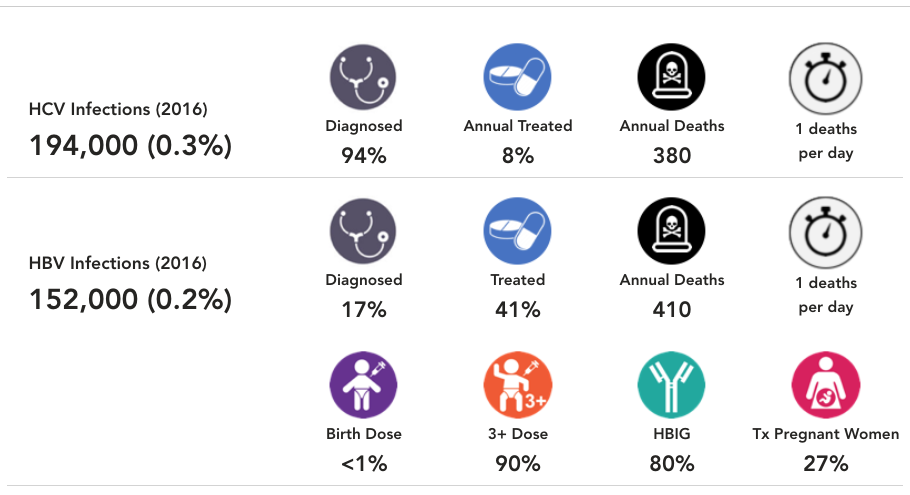
This number represents the percent of cumulative viremic infections already diagnosed by the end of 2022. When data was available, annual registry data was collected, and adjusted for mortality, treatment and SVR. When data was not available, the diagnosis rate was extrapolated from regional data. For more details, please see the appendix associated with: Blach S, Zeuzem S, Manns M, Altraif I, Duberg A-S, Muljono DH, et al. Global prevalence and genotype distribution of hepatitis C virus infection in 2015: a modelling study. The Lancet Gastroenterology & Hepatology. 2017;2(3):161-76.

HCV Treated
This number represents the percent of total viremic infections treated from January 1, 2016 to December 31, 2016. When data was available, annual treatment rate was collected for public and private markets. When data was not available, the treatment rate was extrapolated from regional data. For more details, please see the appendix associated with: Blach S, Zeuzem S, Manns M, Altraif I, Duberg A-S, Muljono DH, et al. Global prevalence and genotype distribution of hepatitis C virus infection in 2015: a modelling study. The Lancet Gastroenterology & Hepatology. 2017;2(3):161-76.

HCV Annual Deaths and Deaths per Period
This number is an output of the CDAF’s Bright HCV Model. It takes into account the number of liver related deaths due to cirrhosis, hepatocellular carcinoma and liver transplantation associated with HCV by the end of 2016. This number excludes all-cause mortality due to other causes. For more details, please see the appendix associated with: Blach S, Zeuzem S, Manns M, Altraif I, Duberg A-S, Muljono DH, et al. Global prevalence and genotype distribution of hepatitis C virus infection in 2015: a modelling study. The Lancet Gastroenterology & Hepatology. 2017;2(3):161-76.

HBV Infections (2022)
The total number of HBsAg+ infections, and HBsAg prevalence at the end of 2022. If the country/territory had a prevalence estimate, the CDAF PRoGReSs HBV model was calibrated to prevalence in the year it was reported. The model output in 2022 is shown here after taking into account incidence and mortality. For countries/territories without a prevalence estimate, a regional average was used. For more details and the original data source, please see: Polaris Observatory Collaborators. Global prevalence, cascade of care, and prophylaxis coverage of hepatitis B in 2022: a modelling study. Lancet Gastroenterol Hepatol. 2023 Jul 27:S2468-1253(23)00197-8. doi: 10.1016/S2468-1253(23)00197-8. Epub ahead of print. PMID: 37517414.

HBV Diagnosed
This number represents the percent of cumulative HBsAg+ infections already diagnosed by the end of 2022. When data was available, annual registry data was collected, and adjusted for mortality. When data was not available, the diagnosis rate was extrapolated from regional data. For more details, please see the appendix associated with: Polaris Observatory Collaborators. Global prevalence, cascade of care, and prophylaxis coverage of hepatitis B in 2022: a modelling study. Lancet Gastroenterol Hepatol. 2023 Jul 27:S2468-1253(23)00197-8. doi: 10.1016/S2468-1253(23)00197-8. Epub ahead of print. PMID: 37517414.

HBV Treated
This number represents the percent of total number of HBsAg+ cases treated by the end of 2022. The PRoGReSs model takes into consideration treatment discontinuation and treatment start, each year, the corresponding impact on disease progression. When data was available, annual treatment rate was collected for public and private markets. When data was not available, the treatment rate was extrapolated from regional data. For more details, please see the article and appendix associated with: Polaris Observatory Collaborators. Global prevalence, cascade of care, and prophylaxis coverage of hepatitis B in 2022: a modelling study. Lancet Gastroenterol Hepatol. 2023 Jul 27:S2468-1253(23)00197-8. doi: 10.1016/S2468-1253(23)00197-8. Epub ahead of print. PMID: 37517414.

HBV Prophylaxis
WHO data was the starting point for HBV birth dose and three dose vaccination rates (WHO. WHO-UNICEF estimates of HepB_BD coverage. 12-Oct-2020 https://apps.who.int/immunization_monitoring/globalsummary/timeseries/tscoveragehepb%5Fbd.html (accessed 20 Oct 2020)). These inputs were modified after interviews with national hepatitis programs. Percent of infants receiving HBIG and percent of HBV positive mothers receiving antiviral treatment was collected through the literature and interview with national experts. For more details, please see the article and appendix associated with: Polaris Observatory Collaborators. Global prevalence, cascade of care, and prophylaxis coverage of hepatitis B in 2022: a modelling study. Lancet Gastroenterol Hepatol. 2023 Jul 27:S2468-1253(23)00197-8. doi: 10.1016/S2468-1253(23)00197-8. Epub ahead of print. PMID: 37517414.

Year of achieving elimination targets graphs explained
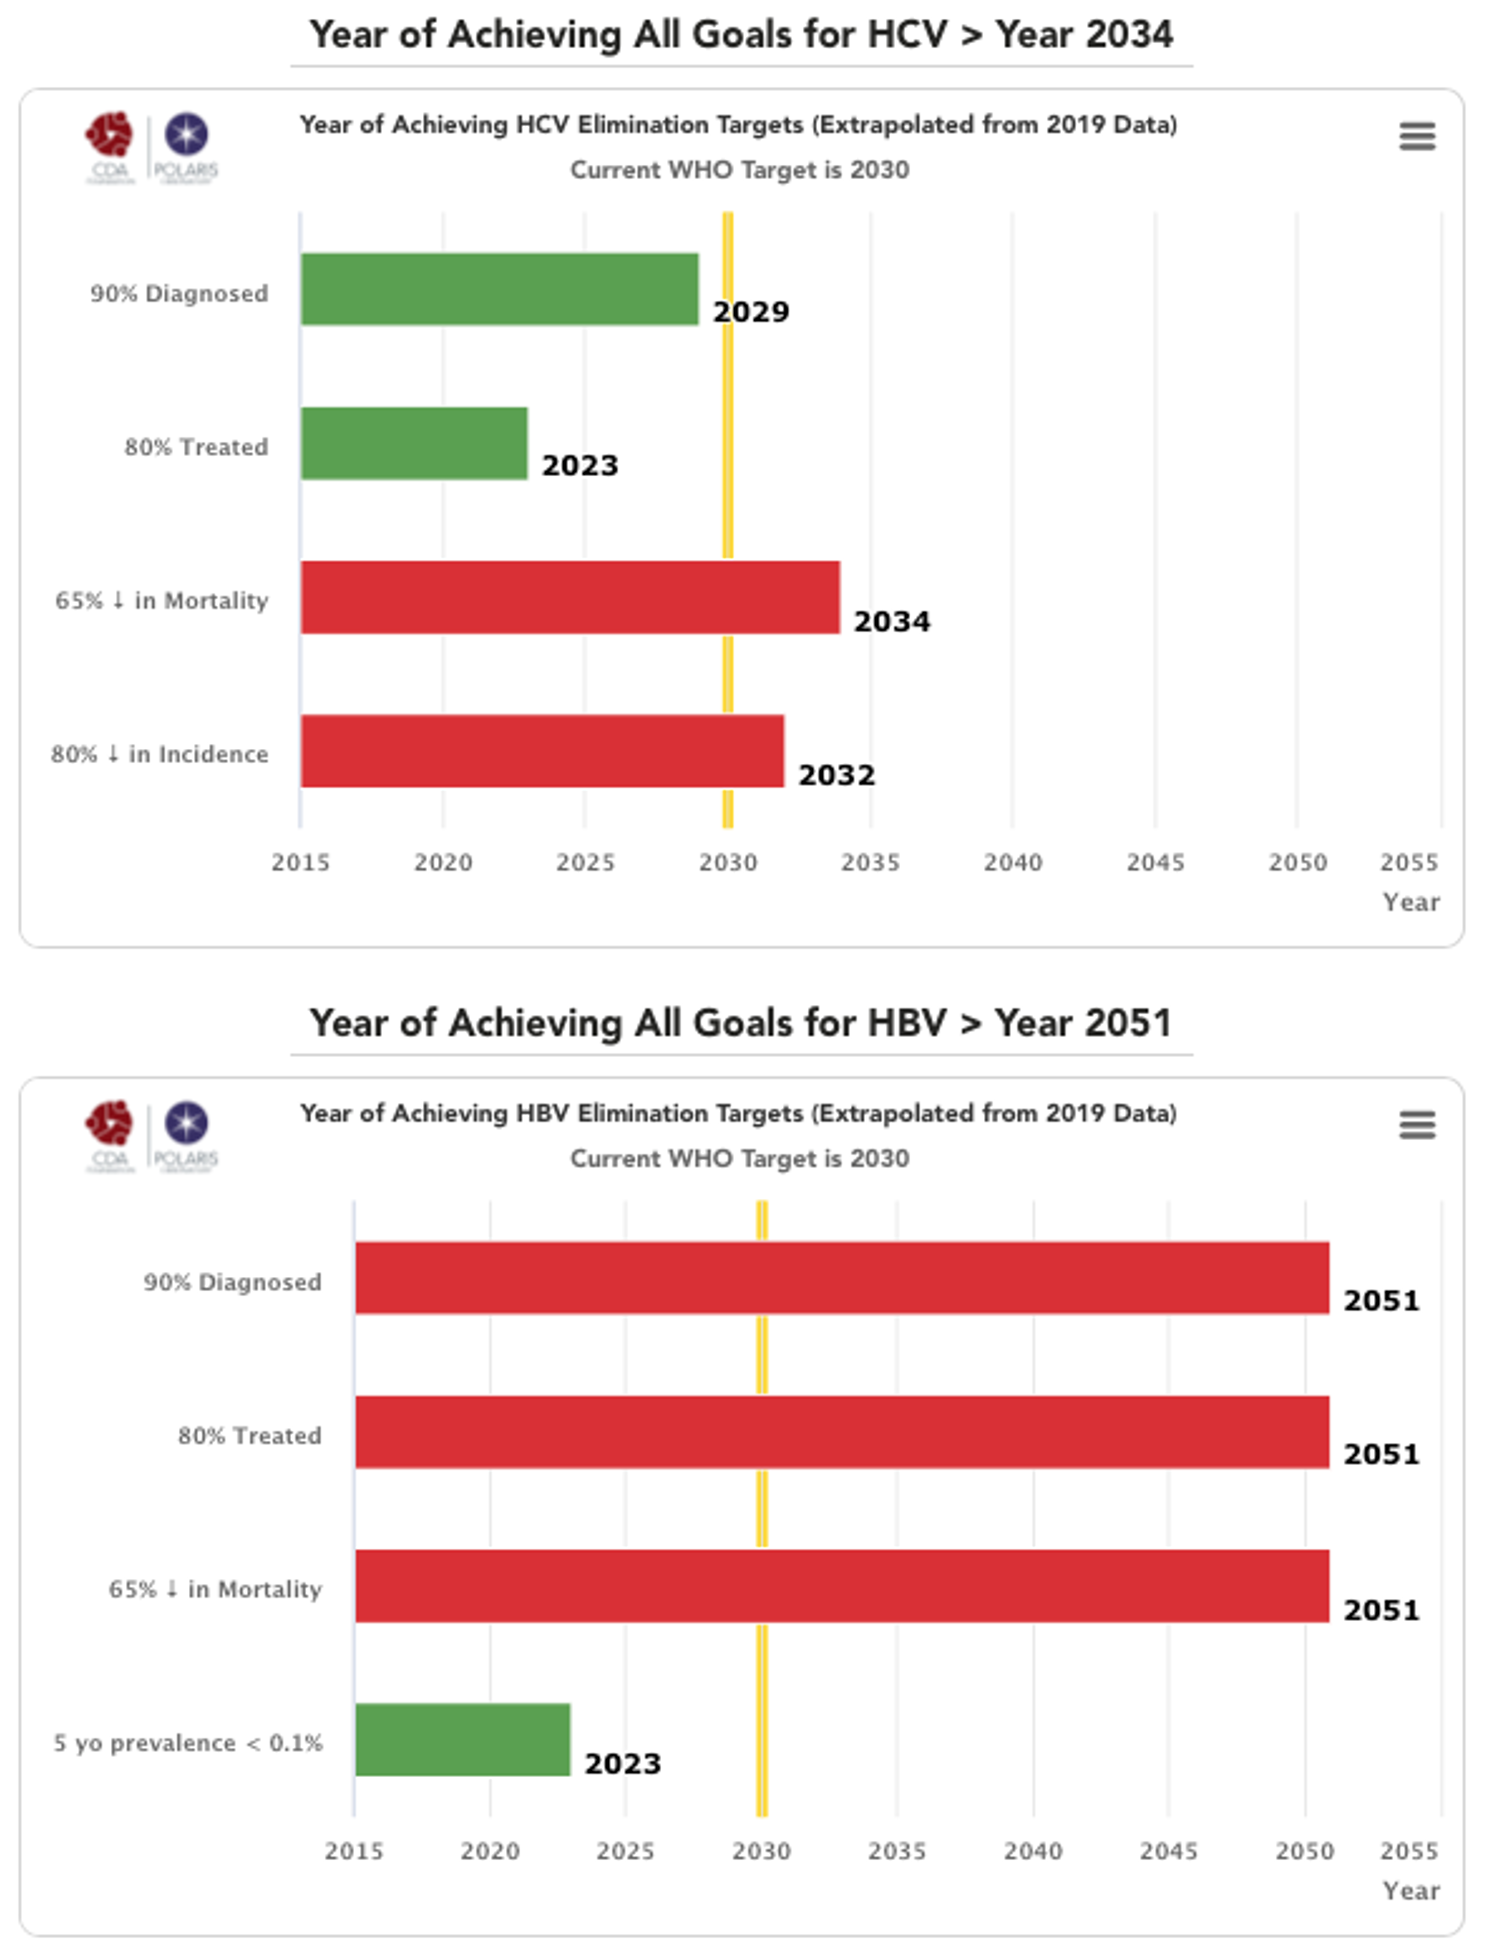
CDA Bright (HCV) and PRoGReSs (HBV) models were used to forecast the year in which each country/territory will achieve the WHO 2030 elimination targets. The targets were assessed individually – when countries/territories will achieve 90% diagnosed, 80% of eligible population treated, 65% reduction in mortality and 80% reduction in incidence for HCV and a 5 year old prevalence of <0.1% for HBV. The latter goal came from WHO WPRO regional strategy. The year that the country/territory will achieve all of these goals is also shown in each section.
Each graph is scaled from achieving the goals from year 2015 to 2055. The yellow line shown in 2030 indicates the WHO goal year. The year each country/territory will achieve the specific target is shown in the bar. The color of the bar changes from green to red depending on when the country/territory will achieve the goals (green if before 2030, red if after 2030).
HCV Diagnosed
In the Bright model, it is assumed that number of screened patients remains constant after the last year of available data. This translates to a decrease in the number of newly diagnosed cases as diagnosis rate increase over time.
HCV Treated
In the Bright model, we assume a 50% drop in the annual number of treated patients over five years from peak treatment, unless better data was available to inform a more accurate forecast. Historical data has shown that it is very difficult to keep the annual number of treated patients constant and it eventually drops in every country/territory.
HCV Mortality
This is a calculated file that calculates the year in which liver related deaths drops by 65% or more as compared to liver related deaths in 2015. In countries/territories with a young population (low mortality in 2015), this is difficult to achieve.
HCV Incidence
In the static version of the Bright model, the change in incidence is tied to prevalence in the population with no fibrosis (F0). If there are treatment restrictions in the country/territory, the F0 population will typically not be treated and prevalence remains constant. As a result, incidence will not drop over time. This approach is appropriate for countries/territories where injection drug use is the main source of new infections. Most of this population is young and tend to be F0. Restricting F0 cases from receiving HCV treatment will mean that HCV transmission will continue, and incidence will not drop. In countries/territories where injection drug use is not the main risk factor, the route of transmission is typically nosocomial. A reduction in prevalence will decrease the viral pool which will also lead to a reduction in incidence. HCV prevalence in the F0 population is an OK approximation of the overall incidence.
We do have a dynamic version of the Bright model and it has been used in 13 countries/territories. Unfortunately, this model requires too many inputs to be used in all countries/territories (the uncertainty in inputs make the model less valuable).
HBV Diagnosed
In the PRoGReSs model, we assume that the number of newly diagnosed cases remains constant after the last year of available data.
HBV Treated
In the PRoGReSs model, we assume that the total number of treated HBV patients per year is constant after the last year of available data.
HBV Mortality
This is a calculated file that calculates the year in which liver related deaths drops by 65% or more as compared to liver related deaths in 2015.
HBV Prevalence Among 5-Year-Olds
The PRoGReSs model is fully dynamic and calculates both horizontal and vertical transmission. The prevalence of HBsAg among five year olds is calculated by the model using the incidence of HBV and clearance rate in infants to five years old. This measure is highly dependent on the HBV vaccination rates and the duration of vaccination, which can result in a lower HBV prevalence among women of child bearding age. For a more detailed description of the model, see Polaris Observatory Collaborators. Global prevalence, cascade of care, and prophylaxis coverage of hepatitis B in 2022: a modelling study. Lancet Gastroenterol Hepatol. 2023 Jul 27:S2468-1253(23)00197-8. doi: 10.1016/S2468-1253(23)00197-8. Epub ahead of print. PMID: 37517414.
Progress towards elimination targets graphs explained
HCV progress toward elimination targets graph
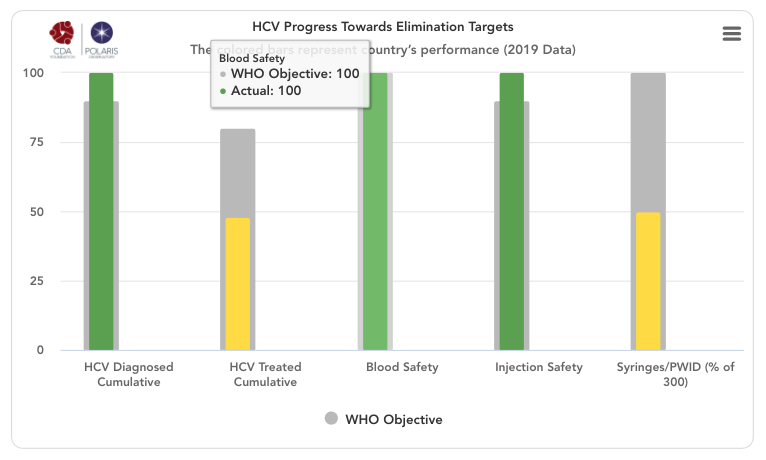
The grey bars represent WHO 2030 elimination targets – 90% of total HCV infections diagnoses, 80% of eligible population treated, 100% of the population has access to safe blood, 100% of injections are safe and 300 sterile syringes & needles are distributed for every person who injects drugs (PWID) (source: Global Hepatitis Report 2017. Geneva: World Health Organization; 2017).
For simplicity, the number of sterile syringes & needles per PWID was put on a scale of 0-100% with 100% indicating 300 distributed per year per PWID. The bars in the front represent how the country/territory is progressing toward these goals in the year indicated in the title. These bars change color from red to orange to yellow to green depending on how the country/territory is performing toward these goals. Hovering over the bars will show the actual numbers. A missing bar represents zero or missing data. Hovering over the bar will distinguish been a zero or no data.
HCV Diagnosed Cumulative
Cumulative number of patients diagnosed previous to December 31, (year indicated in the title) divided by 2015 prevalence. This WHO target does not take into account new infections after 2015 since it relies on 2015 prevalence. Thus, total diagnosed can be 100% if a country/territory has a high diagnosis rate and it continues to diagnose new infections after 2015.
HCV Treated Cumulative
Cumulative number of patients treated between January 1, 2015 and December 31, (year indicated in the title) divided by 90% of 2015 prevalence (90% of all infections are diagnosed and eligible for treatment). This measure excludes mortality among those who were treated from 2015 forward.
Blood Safety
This data came from the following sources: Global status report on blood safety and availability 2016. Geneva: World Health Organization; 2017. Current Status on Blood Safety and Availability in the WHO African Region — Report of the 2013 Survey. Geneva: World Health Organization; 2017. Pan American Health Organization (PAHO). Supply of blood for transfusion in Latin American and Caribbean countries, 2014 and 2015. Washington, D.C.: 2017. [Azerbaijan: Iranian Blood Transfusion Organization Department of International Affairs . ECO Blood Safety Network. October 2013. http://www.ecobsn.com/] When data for the latest year of analysis was not available, rate in the last year of available data was kept constant.
Injection Safety
This data came from the following source: ICF, 2015. The DHS Program STATcompiler. Funded by USAID. http://www.statcompiler.com. November 13 2019. Pepin J, Abou Chakra CN, Pepin E, Nault V, Valiquette L. Evolution of the global burden of viral infections from unsafe medical injections, 2000-2010. PLoS One. 2014;9(6):e99677. Epub 2014/06/10. doi: 10.1371/journal.pone.0099677. When data for the latest year of analysis was not available, rate in the last year of available data was kept constant.
Syringes / PWID
This data came from the following source: Larney S, Peacock A, Leung J, et al. Global, regional, and country-level coverage of interventions to prevent and manage HIV and hepatitis C among people who inject drugs: a systematic review. Lancet Glob Health 2017; published online Oct 23. http://dx.doi.org/10.1016/S2214-109X(17)30373-X. UNAIDS. Key Population Atlas – People who Inject Drugs, Needles per Injector. 2019. Accessed 09 Jan 2020 from http://kpatlas.unaids.org/dashboard Last updated: 08 Aug 2019. When data for the latest year of analysis was not available, rate in the last year of available data was kept constant.
HBV progress toward eliminating target graph
The grey bars represent WHO 2030 elimination targets – 90% of all HBV infections diagnoses, 80% of eligible population treated, 90% of the infants receive a timely birth dose, 90% of all infants receive three doses of HBV vaccine, 100% of the population has access to safe blood, 100% of injections are safe and 300 sterile syringes & needles are distributed for every person who injects drugs (PWID) (source: Global Hepatitis Report 2017. Geneva: World Health Organization; 2017).
Treatment eligibility used WHO treatment protocols: HBV diagnosed individuals with a high viral load (=20 000 IU/mL), with cirrhosis or hepatocellular carcinoma, or who have undergone liver transplantation.
For simplicity, the number of sterile syringes & needles per PWID was put on a scale of 0-100% with 100% indicating 300 distributed per year per PWID. The bars in the front represent how the country/territory is progressing toward these goals in the year indicated in the title. These bars change color from red to orange to yellow to green depending on how the country/territory is performing toward these goals. Hovering over the bars will show the actual numbers. A missing bar represents zero or missing data. Hovering over the bar will distinguish been a zero or no data in the actual field.
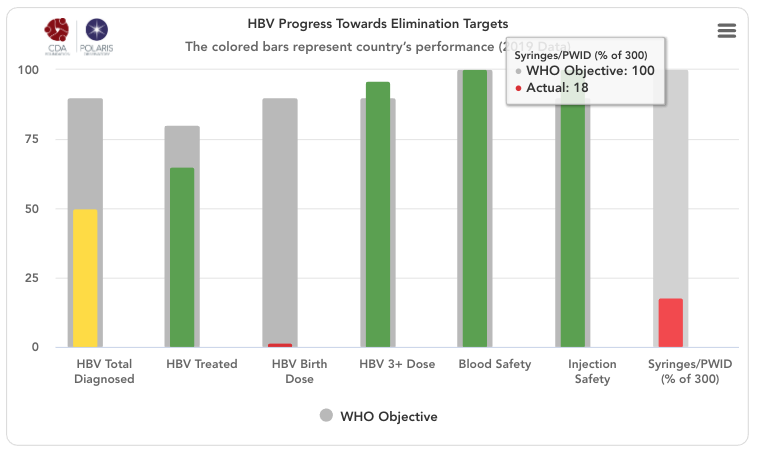
HBV Total Diagnosed
Cumulative number of patients diagnosed previous to December 31, (year indicated in the title) divided by the same year’s HBsAg prevalence.
HBV Treated
Number of patients on treatment by December 31, (year indicated in the title) divided by total treatment eligible population by December 31, (year indicated in the title). We are using WHO’s definition of eligibility which is: HBV diagnosed individuals with a high viral load (=20 000 IU/mL), with cirrhosis or hepatocellular carcinoma, or who have undergone liver transplantation.
Birth Dose
Percent of infants born in (year indicated in the title) who receive a timely birth dose (within the first 24 hours of life) HBV vaccination. WHO country/territory data was the starting point for HBV birth dose vaccination rates (WHO. WHO-UNICEF estimates of HepB_BD coverage. 12-Oct-2020 https://apps.who.int/immunization_monitoring/globalsummary/timeseries/tscoveragehepb%5Fbd.html (accessed 20 Oct 2020)). These inputs were modified after interviews with national hepatitis programs. For more details, please see the article and appendix associated with: Polaris Observatory Collaborators. Global prevalence, cascade of care, and prophylaxis coverage of hepatitis B in 2022: a modelling study. Lancet Gastroenterol Hepatol. 2023 Jul 27:S2468-1253(23)00197-8. doi: 10.1016/S2468-1253(23)00197-8. Epub ahead of print. PMID: 37517414. When data for the latest year was not available, vaccination rate in the last year of available data was kept constant.
HBV 3+ Dose
Percent of infants born in year indicated in the title who receive Three or more doses of HBV vaccination. WHO country/territory data was the starting point for HBV three dose vaccination rates (WHO. WHO-UNICEF estimates of HepB3 coverage. 12-Oct-2020 https://apps.who.int/immunization_monitoring/globalsummary/timeseries/tscoveragehepb3.html (accessed 20 Oct 2020)). These inputs were modified after interviews with national hepatitis programs. For more details, please see the article and appendix associated with: Polaris Observatory Collaborators. Global prevalence, cascade of care, and prophylaxis coverage of hepatitis B in 2022: a modelling study. Lancet Gastroenterol Hepatol. 2023 Jul 27:S2468-1253(23)00197-8. doi: 10.1016/S2468-1253(23)00197-8. Epub ahead of print. PMID: 37517414. When data for the latest year was not available, vaccination rate in the last year of available data was kept constant.
Blood Safety
This data came from the following sources: Global status report on blood safety and availability 2016. Geneva: World Health Organization; 2017. Current Status on Blood Safety and Availability in the WHO African Region — Report of the 2013 Survey. Geneva: World Health Organization; 2017. Pan American Health Organization (PAHO). Supply of blood for transfusion in Latin American and Caribbean countries, 2014 and 2015. Washington, D.C.: 2017. [Azerbaijan: Iranian Blood Transfusion Organization Department of International Affairs . ECO Blood Safety Network. October 2013. http://www.ecobsn.com/] When data for the latest year was not available, rate in the last year of available data was kept constant.
Injection Safety
This data came from the following source: ICF, 2015. The DHS Program STATcompiler. Funded by USAID. http://www.statcompiler.com. November 13 2019. Pepin J, Abou Chakra CN, Pepin E, Nault V, Valiquette L. Evolution of the global burden of viral infections from unsafe medical injections, 2000-2010. PLoS One. 2014;9(6):e99677. Epub 2014/06/10. doi: 10.1371/journal.pone.0099677. When data for the latest year was not available, rate in the last year of available data was kept constant.
Syringes / PWID
This data came from the following source: Larney S, Peacock A, Leung J, et al. Global, regional, and country-level coverage of interventions to prevent and manage HIV and hepatitis C among people who inject drugs: a systematic review. Lancet Glob Health 2017; published online Oct 23. http://dx.doi.org/10.1016/S2214-109X(17)30373-X. UNAIDS. Key Population Atlas – People who Inject Drugs, Needles per Injector. 2019. Accessed 09 Jan 2020 from http://kpatlas.unaids.org/dashboard Last updated: 08 Aug 2019.
If you have additional questions that are not answered here, please contact us at info@cdafound.org.
Hepatitis elimination policies – qualitative assessment graphs explained
We reviewed the national strategies and compared them against countries/territories that are on course to eliminate viral hepatitis by 2030, and we identified 8 factors that will predict if a country/territory will achieve the WHO hepatitis elimination targets.
We found that the primary predictor of achieving the elimination targets was political will. There are many examples of countries/territories that have no restrictions in place but the system makes it difficult for patients to access treatment and diagnostics. However, political will had to be supplemented with seven other factors needed in a national program to make hepatitis elimination a reality. Countries/territories that scored high in all of these factors had a much higher likelihood of achieving the WHO elimination targets by 2030. This analysis also helps identify the deficiencies in the current national program where a holistic approach is needed to achieve national elimination (simply offering treatment will not achieve the 2030 goals).
We developed a qualitative scoring system for each factor and asked experts from each country/territory to score their national program. They could provide a different input for the national hepatitis B and C programs. The average of all responses for each country/territory are presented here. If we did not receive inputs from country/territory experts, these graphs are missing.
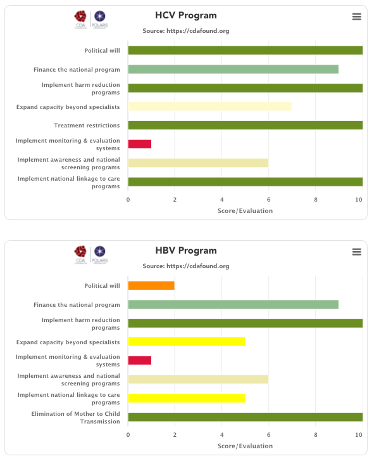
(1) Political will
Political will to eliminate hepatitis is a key predictor of achieving the elimination targets. All countries/territories listed on the Polaris Observatory as being on the path to elimination have all made a commitment to eliminate hepatitis and they put in place programs to make this a reality. Unfortunately, political will can only be measured by how well a country/territory implements the other factors listed below, which are needed to achieve elimination. With this in place, the national governments will make sure the remaining factors are dealt with appropriately. Without political will, the national government can claim that they are doing everything, but detailed analysis of these programs quickly identifies barriers in place that will prevent achieving the elimination goals.
We use a multi-objective decision analysis scaling framework (Keeney RL, Raiffa H. Decisions with Multiple Objectives: Preferences and Value Tradeoffs. Cambridge University Press 1993) which uses a non-linear scoring scale. The definitions for political will scores are shown below.


(2) Finance the national program
A key barrier to hepatitis elimination is financing the national program. However, study after study has shown that the cost of doing nothing is higher than going after the elimination targets. All countries/territories with a political will to eliminate hepatitis have also developed strategies to fund their programs. These strategies include paying for the program out of their national budget (HCV – Australia, Switzerland, Germany, UK, Egypt, Mongolia…), supplementing the national funding by loans (HCV – Egypt, Mongolia), supplementing the national funding by getting donated medicine and/or diagnostics (HCV – Georgia, Iceland, Rwanda; HBV – Kiribati). The definition for each score is shown below.

(3) Implement harm reduction
Elimination of viral hepatitis will not be possible unless the number of new infections is reduced. The risk factors for new infections vary by country/territory with injection drug and men having sex with men being key risk factors for HCV in Western countries/territories. However, in the rest of the world, nosocomial infection remains as a leading cause of new HCV infections. Thus, blood safety and injection safety in the healthcare setting are requirements for achieving the hepatitis elimination targets. For hepatitis B, prenatal transmission remains the largest risk factor for chronic HBV infections which can be minimized with a robust prophylaxis program. The definition for each score is shown below.


(4) Expanded treatment capacity
There are simply not enough liver specialists to treat all hepatitis B and C infections. The shortage of liver specialists is exacerbated in low and middle income countries/territories (LMIC). In high income countries/territories with a large number of specialists, they are often located at the tertiary centers in major cities. This can create a barrier to access. The ASCENT clinical studies (Kattakuzhy S, Gross C, Emmanuel B, Teferi G, Jenkins V, Silk R, Akoth E, et al. Expansion of Treatment for Hepatitis C Virus Infection by Task Shifting to Community-Based Nonspecialist Providers: A Nonrandomized Clinical Trial. Ann Intern Med 2017;167:311-318) showed that the HCV sustained viral response is the same whether a patient is treated by a specialist, primary care physician (PCP), or a nurse practitioner. Similar results have been observed in Australia and New Zealand. The more advanced patients, with cirrhosis and HCC, are still referred to specialists. However, the PCPs affiliated with harm reduction programs and prisons can write prescriptions for diagnosed patients without the need to refer the patients without advanced liver disease. The definition for each score is shown below.


(5) Remove all restrictions
For hepatitis C treatment, some countries/territories continue to restrict access to the treatments. However, any explicit or unintended restrictions will prohibit achieving the elimination targets. This includes requiring referrals, multiple tests, or limiting treatment to major hospitals that require travel for some patients. Hepatitis B was not assessed on this measure because the treatment restrictions are numerous and part of all liver society and WHO guidelines. As shown on the Polaris Observatory, no country/territory is going to achieve the WHO target of reducing HBV related mortality by 65% by 2030. The current liver society and WHO treatment guidelines are simply too restrictive to allow countries/territories to achieve this goal. The definition for each score is shown below for HCV only.

(6) Put in place monitoring and evaluation systems
A robust monitoring and evaluation program will assure that the elimination programs are implemented in an efficient manner. These systems can be used to monitor progress toward elimination and help validate the countries’/territories’ accomplishment. The definition for each score is shown below.

(7) Actively screen & implement awareness programs
Active screening in needed to find the portion of the hepatitis infected population that remains undiagnosed. This has been a key barrier to the global elimination efforts. However, active screening without an awareness program will result in suboptimal outcomes. There are numerous examples of high income countries/territories where >80% of the HCV infected population is estimated to be already diagnosed, yet the number of treated patients is decreasing over time. Awareness programs are also needed to motivate patients to seek care. The definition for each score is shown below.

(8) Linkage to care programs
Screening and awareness are not sufficient to achieve the elimination goals. Active programs to link patients to care are also needed. For example, most blood banks notify donors who test positive for HCV or HBV and recommend that they see a physician. However, none have a program that links those testing positive to care. In countries/territories with a high diagnosis rate, linkage to care will be a major limitation to achieving the elimination goals. The definition for each score is shown below.

Elimination of mother to child transmission
The highest risk factor for new chronic HBV infections is still perinatal transmission. Thus, we added a separate factor to assess how countries/territories are doing in minimizing mother to child transmission. Hepatitis B prophylaxis programs have a number of tools available to them – screening of pregnant women, timely HBV birth dose (24 hours after birth), three doses of HBV vaccine after birth, hepatitis B immunoglobin (HBIG) for infants born to HBV positive mothers and treatment of HBV positive pregnant women with antiviral therapy in the last trimester. The definition for each score is shown below.

